Time:2011-07-16ClickTimes:
Xinli Zhu, Jiasen Zhang, Jun Xu, Heng Li, Xiaosong Wu, Zhimin Liao, Qing Zhao, and Dapeng Yu
ACS NANO, 2011
Abstract: We experimentally demonstrate the dependence of plasmonic resonant properties on cavity height in open circular cylinder nanocavities as a result of a strong three-dimensional confinement of electromagnetic field, which shows a new way to tailor the dispersion of surface plasmon polaritons (SPPs) in cavities. The azimuthal and the axial symmetric plasmonic mode patterns are directly observed at resonant wavelengths using cathodoluminescence spectroscopy. Plasmonic modes and optical vertical cavity modes can be simultaneously excited and can coexist in a nanocavity with sufficient height. The highest quality factor, which is up to 73, is obtained in a 500 nm-high cavity. The smallest mode volume is only 0.031λ3SPPand the corresponding Purcell factor is 71. Open nanocavities provide space for interaction between optical emitter and confined electromagnetic field. Many applications can be expected, such as plasmonic light-emitting devices and nanolasers.

|
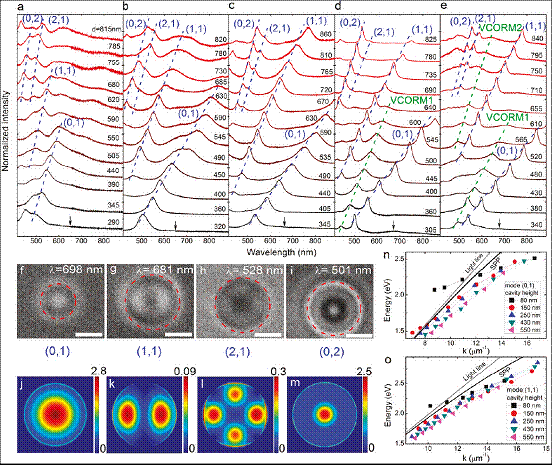
Figure: Spontaneous excitation of plasmonic resonant modes and vertical cavity resonant modes in Ag nanocavity via CL spectroscopy analysis. (a-e) CL spectra of nanocavities with 80, 150, 250,430, and 550 nm heights, respectively. The numbers on the right side of the figures indicate the diameters of the cavities in nm. The spectra were obtained when the electron beam was incident near the centers of the cavities. The plasmonic modes are classified and indicated with blue dotted lines and characters, respectively. Spectra are offset vertically for clarity. (f) Typical monochromatic CL image at a resonant wavelength of 698 nm for a cavity with a 490 nm diameter. (g-i) Typical monochromatic CL images at resonant wavelengths of 681, 528, and 501nmfor a cavity with a 765nmdiameter, respectively. The red dashed circles show the boundaries of the cavities. Scale bars are 500 nm. (j-m) Calculated intensity patterns of the out-of-plane electric components for the plasmonic modes (0, 1), (1, 1), (2, 1), and (0, 2), respectively. (n, o) Dispersions of plasmonic modes (0, 1) and (1, 1) in the nanocavities. The gray and black lines respectively represent the dispersions of light in vacuum and SPPs on an infinite Ag film.
|
